Apache log analysis post
Installation
apt-get install -y gnuplot goaccess jq
BASH script
RESULT_FILE=results.csv

>$RESULT_FILE
for LOG_FILE in access-*.log
do
    echo $LOG_FILE
    OUTPUT_FILE=${LOG_FILE//access-/}
    OUTPUT_FILE=${OUTPUT_FILE//_00_00_00.log/}
    goaccess $LOG_FILE --log-format=COMMON -o $OUTPUT_FILE.json --ignore-panel=REQUESTS --ignore-panel=REQUESTS_STATIC --ignore-panel=NOT_FOUND --ignore-panel=HOSTS --ignore-panel=OS --ignore-panel=BROWSERS --ignore-panel=VISIT_TIMES --ignore-panel=VIRTUAL_HOSTS --ignore-panel=REFERRERS --ignore-panel=REFERRING_SITES --ignore-panel=KEYPHRASES --ignore-panel=STATUS_CODES --ignore-panel=REMOTE_USER --ignore-panel=GEO_LOCATION
    HITS=$(jq '.visitors.data[0].visitors.count' $OUTPUT_FILE.json)
    DATE=$(jq '.visitors.data[0].data' $OUTPUT_FILE.json | tr -d '"')
    echo -e $DATE,$HITS >> $RESULT_FILE
done

gnuplot <<- EOF
    set datafile separator ","
    set timefmt '%Y%m%d'
    set format x '%m-%d'
    set xlabel "time"
    set ylabel "visitors"
    set title "Visitors over time"
    set term png size 800,400
    set output "${FILE}.png"
    set xdata time
    set boxwidth 0.5
    set style fill solid
    set xtics rotate

    plot "$RESULT_FILE" using 1:2 with boxes
EOF

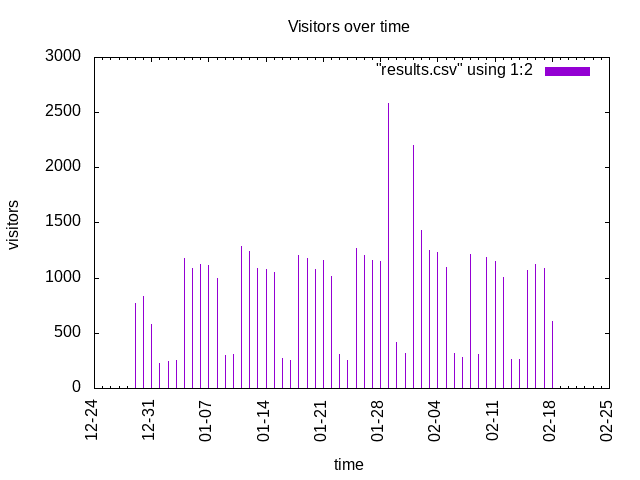
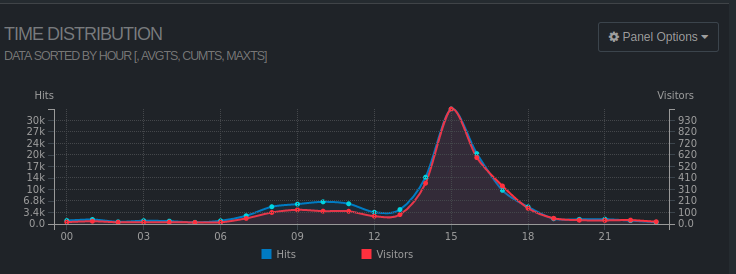
Here, we find there is a rush on 2021_01_29_00_00_00, let's analyse time distribution with:
goaccess access-2021_01_29_00_00_00.log --log-format=COMMON -o report_29_01.html --ignore-panel=REQUESTS --ignore-panel=REQUESTS_STATIC --ignore-panel=NOT_FOUND --ignore-panel=HOSTS --ignore-panel=OS --ignore-panel=BROWSERS --ignore-panel=VIRTUAL_HOSTS --ignore-panel=REFERRERS --ignore-panel=REFERRING_SITES --ignore-panel=KEYPHRASES --ignore-panel=STATUS_CODES --ignore-panel=REMOTE_USER --ignore-panel=GEO_LOCATION

Max at 15:00, let's dig further
