Fork me on GitHub

Fix static @IP on RPI

GET DNS servers @IPs

cat /etc/resolv.conf 

=>

nameserver 89.2.0.1
nameserver 89.2.0.2

Set up fix @IP

In /etc/dhcpcd.conf, add the following lines:

interface eth0
static ip_address=192.168.0.13
static routers=192.168.0.1
static domain_name_servers=89.2.0.1 89.2.0.2

Apache log analysis

Installation

apt-get install -y  gnuplot goaccess jq

BASH script

RESULT_FILE=results.csv

>$RESULT_FILE
for LOG_FILE in access-*.log
do
    echo $LOG_FILE
    OUTPUT_FILE=${LOG_FILE//access-/}
    OUTPUT_FILE=${OUTPUT_FILE//_00_00_00.log/}
    goaccess $LOG_FILE --log-format=COMMON -o $OUTPUT_FILE.json --ignore-panel=REQUESTS --ignore-panel=REQUESTS_STATIC --ignore-panel=NOT_FOUND --ignore-panel=HOSTS --ignore-panel=OS --ignore-panel=BROWSERS --ignore-panel=VISIT_TIMES --ignore-panel=VIRTUAL_HOSTS --ignore-panel=REFERRERS --ignore-panel=REFERRING_SITES --ignore-panel=KEYPHRASES --ignore-panel=STATUS_CODES --ignore-panel=REMOTE_USER --ignore-panel=GEO_LOCATION
    HITS=$(jq '.visitors.data[0].visitors.count' $OUTPUT_FILE.json)
    DATE=$(jq '.visitors.data[0].data' $OUTPUT_FILE.json | tr -d '"')
    echo -e $DATE,$HITS >> $RESULT_FILE
done

gnuplot <<- EOF
    set datafile separator ","
    set timefmt '%Y%m%d'
    set format x '%m-%d'
    set xlabel "time"
    set ylabel "visitors"
    set title "Visitors over time"
    set term png size 800,400
    set output "${FILE}.png"
    set xdata time
    set boxwidth 0.5
    set style fill solid
    set xtics rotate

    plot "$RESULT_FILE" using 1:2 with boxes
EOF

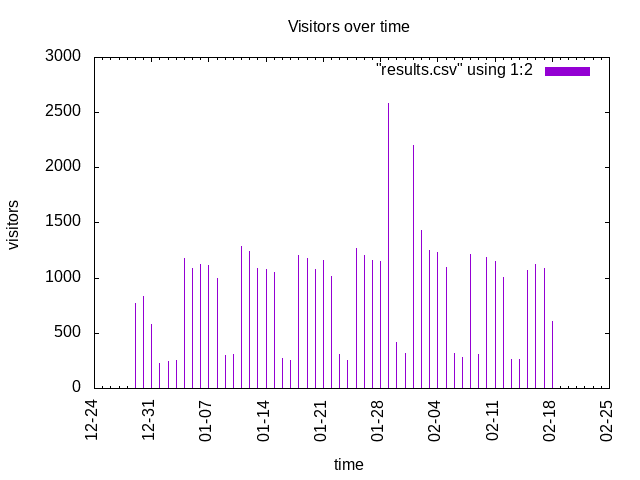
screenshot

Here, we find there is a rush on 2021_01_29_00_00_00, let's analyse time distribution with:

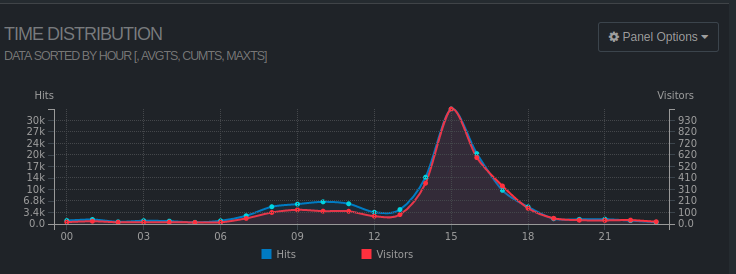
goaccess  access-2021_01_29_00_00_00.log --log-format=COMMON -o report_29_01.html --ignore-panel=REQUESTS --ignore-panel=REQUESTS_STATIC --ignore-panel=NOT_FOUND --ignore-panel=HOSTS --ignore-panel=OS --ignore-panel=BROWSERS --ignore-panel=VIRTUAL_HOSTS --ignore-panel=REFERRERS --ignore-panel=REFERRING_SITES --ignore-panel=KEYPHRASES --ignore-panel=STATUS_CODES --ignore-panel=REMOTE_USER --ignore-panel=GEO_LOCATION

screenshot

Max at 15:00, let's dig further

wireshark basics

install

sudo apt install wireshark -y

answer yes to allow wireshark execution question for non super user.

sudo usermod -aG wireshark $(whoami)

logout and login

Add src & destination port columns

right clock "column preferences" and add "source port" & "destination port"

sniff post request on a uri pattern

http.request.method == "POST" && http.request.uri contains login 

Scan LAN

Let's use nmap to san lan and choose the @IP machine to listen. Here it's a RPI.

sudo nmap -sT -O 192.168.1.0/24

=>

Starting Nmap 7.60 ( https://nmap.org ) at 2021-02-17 10:09 CET
Nmap scan report for XYZ-eth0 (192.168.1.68)
Host is up (0.0030s latency).
Not shown: 994 closed ports
PORT     STATE SERVICE
21/tcp   open  ftp
22/tcp   open  ssh
80/tcp   open  http
443/tcp  open  https
3000/tcp open  ppp
5432/tcp open  postgresql
MAC Address: B8:27:EB:39:1D:77 (Raspberry Pi Foundation)

Wireshark over ssh via sshdump

Install tools on the remote server

apt install -y tcpdump

Allow tcpdump execution for non superuser

sudo groupadd pcap
sudo usermod -a -G pcap $USER
sudo chgrp pcap /usr/sbin/tcpdump
sudo chmod 750 /usr/sbin/tcpdump
sudo setcap cap_net_raw,cap_net_admin=eip /usr/sbin/tcpdump

logout & login

check this command is running without error:

tcpdump -A port '(80 or 443)'

When this part is ok, we can now use wireshark to use tcp dump over ssh. This can be checked with an ssh command:

ssh XXX@192.168.1.68 "sudo tcpdump"

Configure wireshark to listen over ssh

From the main menu, select ssh remote capture: sshdump

Fill in the windows

We can now capture packets.

Wireshark filters

http
ip.dst == 192.168.1.68
ip.src == 192.168.1.68
http.request.method == "POST" 
http.request.method == "POST" && http.request.uri contains login
tcp.port==80
tcp.port==443